


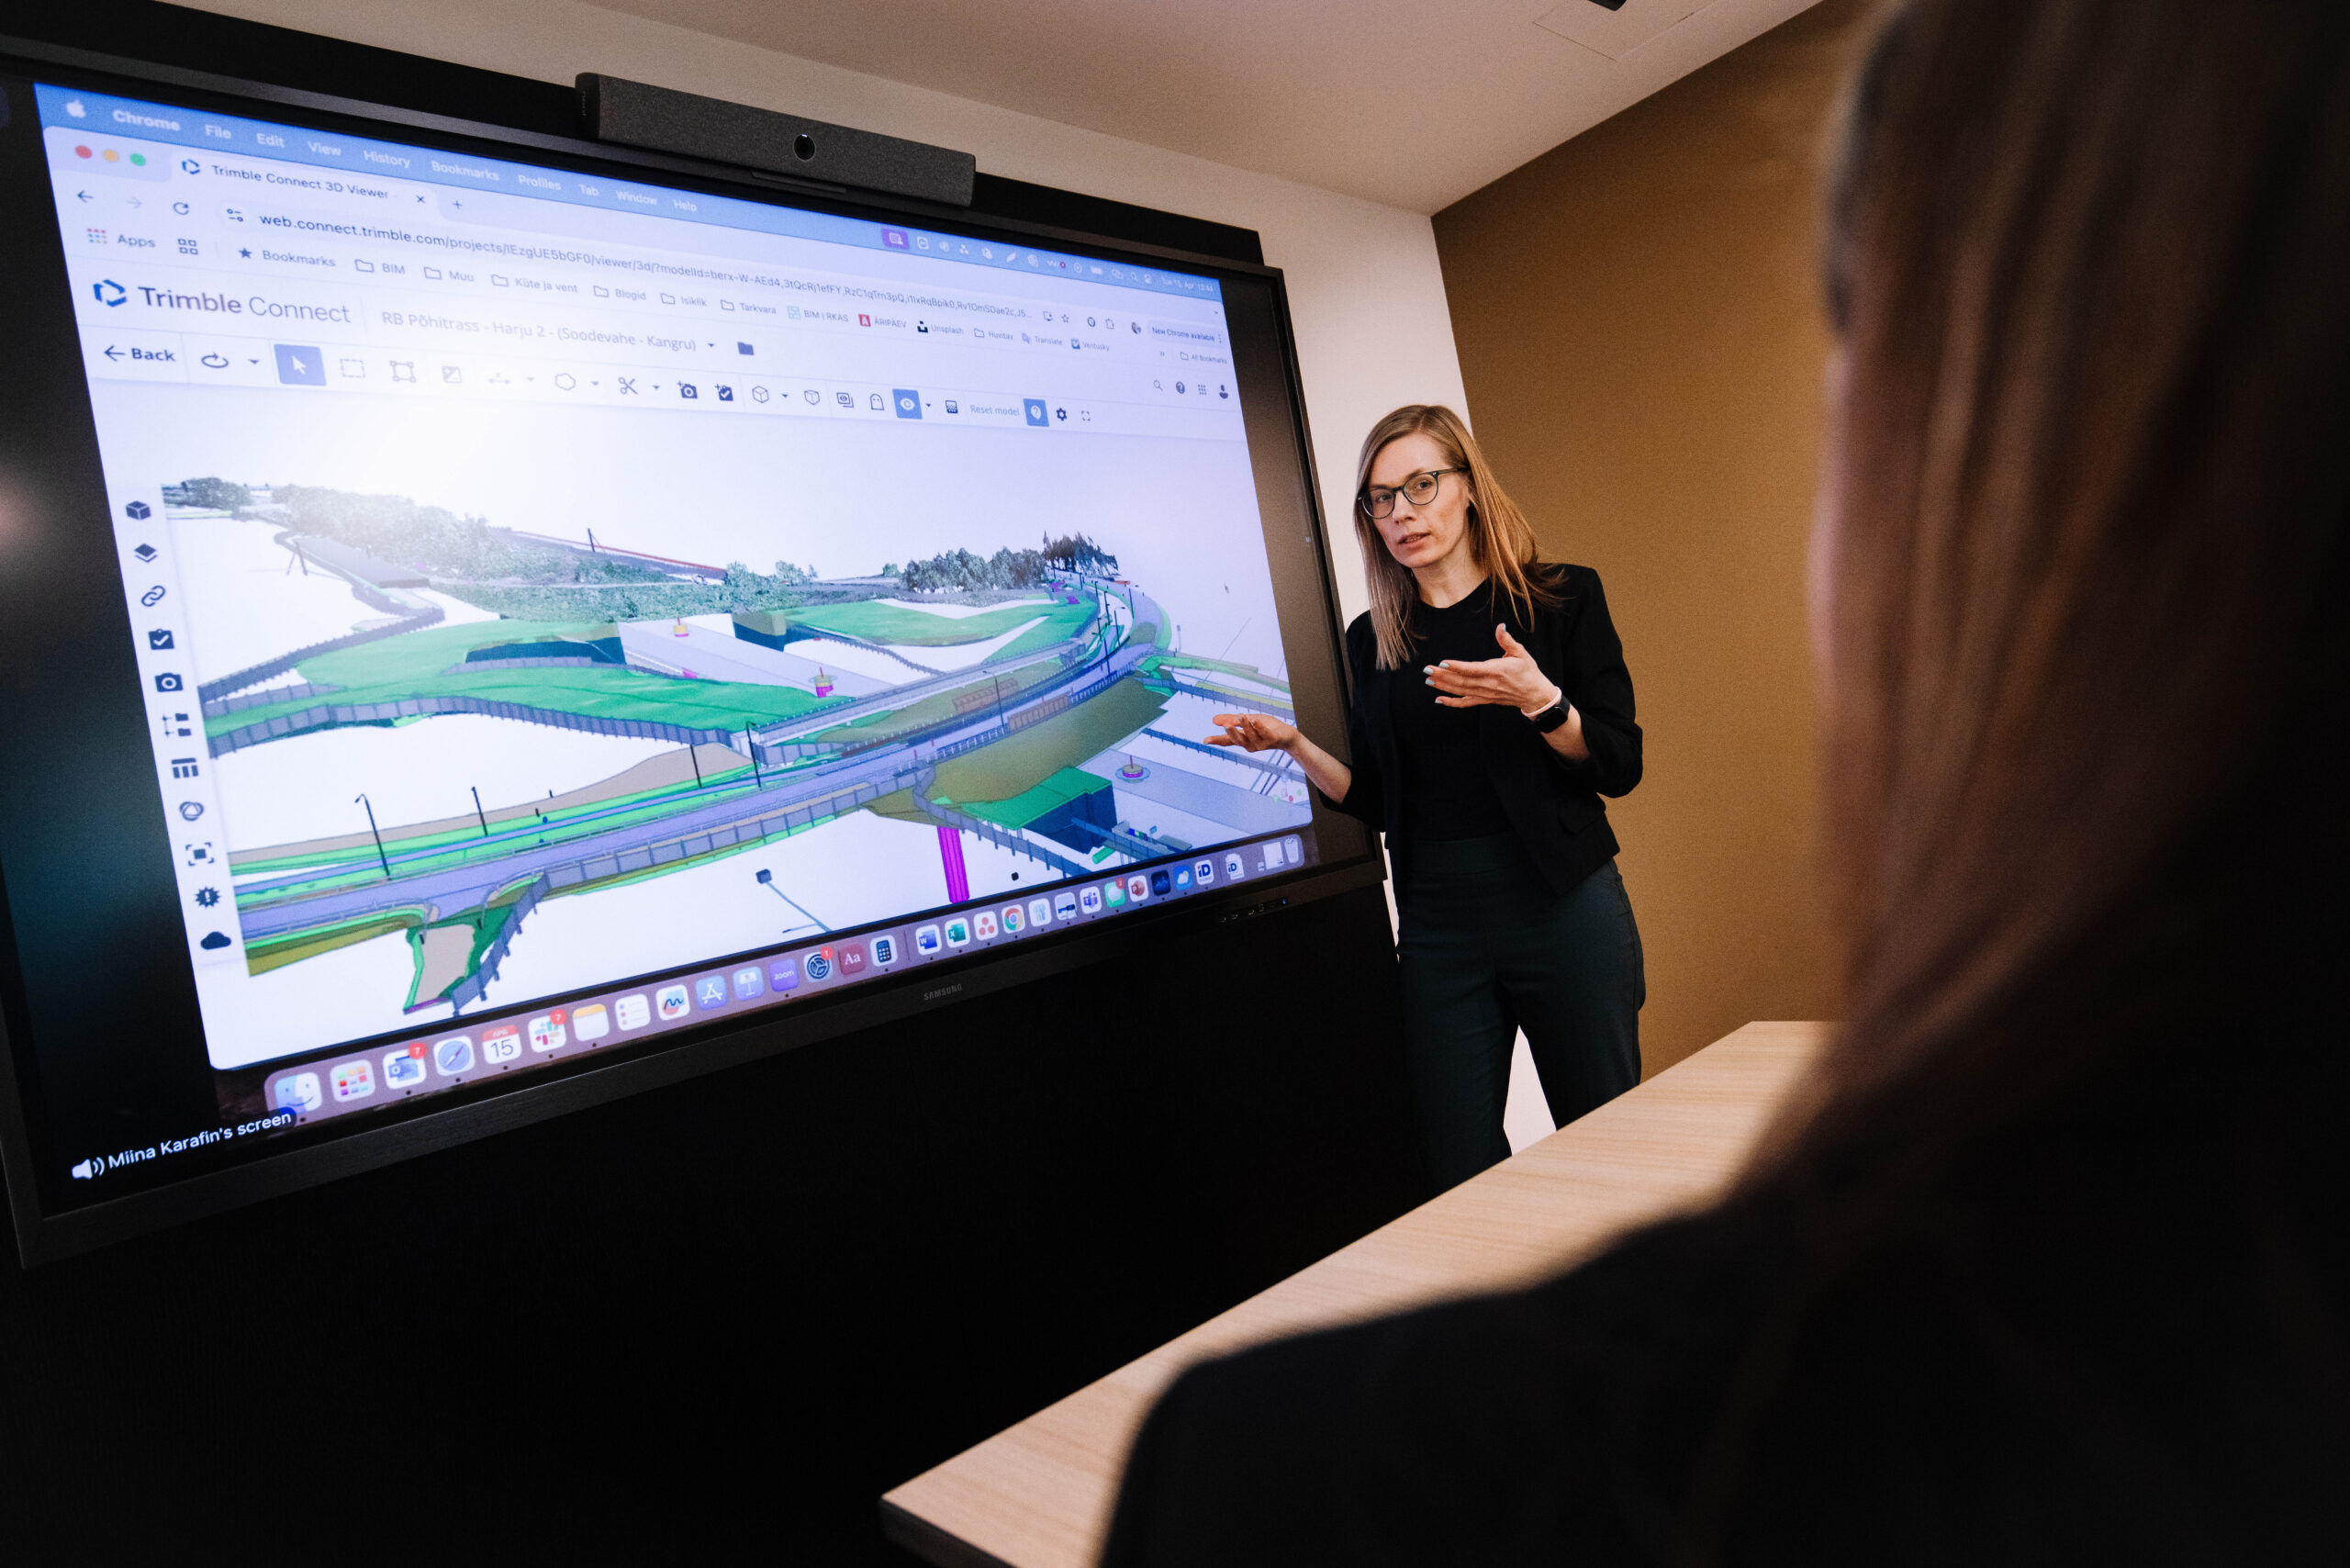

Construction site data: why discipline matters more than software
Miina Karafin, Head of Digitalization & BIM, Verston · based on a talk given at InfraBIM Open in Paris, June 2026
The problem nobody talks about
Research keeps showing the same thing: most large infrastructure projects run over budget, over schedule, or both. Oxford professor Bent Flyvbjerg’s database of 16,000 projects across 136 countries finds that only 8.5% finish on time and on budget.1 A KPMG global survey adds that just 25% finish within 10% of their original deadline.2
And yet every project starts the same way – new site, new team, new plan, the same optimism. Every time, we place ourselves among the few who will get it right.
Ten years of leading BIM and digital transformation have taught me one thing above all: the problem is never the technology.
“You can buy the most sophisticated software on the market. On its own, it solves nothing.”
This matters especially now, when everyone is talking about AI – even in construction. But AI grows out of consistent, structured data, gathered the same way every week, and construction site data is simply not there yet.
Every project has three realities
Every project has three realities: the plan, the reports, and the truth – what is actually happening on site. The first two are always in order. The third is usually a black box.
Financial data is precise; we can track costs to the day. The documentation we produce for the client is precise. But how many cubic meters have actually been completed today, right now?
Here is the trap: when the cost has been incurred, we assume the work is done. The two feel like the same thing, but the money moving does not mean the earth moved. And we rarely verify, because checking feels like extra work for an already stretched team.
When a company tries to standardize data collection, it hits the same wall every time: “Our project is different. You can’t standardize this.” But look at what we actually measure on every project – volumes, layers, deviations from the design. The structure is identical.
“The projects are unique. The excuse isn’t.”
What actually drives change
If technology is not the answer, what is? Three things – none of them software.
The business must demand it. If leadership doesn’t treat missing site data as a business problem, it stays a pilot project forever. AI never delivers value from a single pilot; it needs scale and consistency across projects.
Process before the tool. Daily data collection is an operational decision, as non-negotiable as safety on site. It belongs in the company’s standards; it’s not an IT project.
Consistency is the only path. It has to happen on every site, every week – a single drone flight or experiment changes nothing. A weekly picture of what has actually been built is the foundation of every good planning and forecasting decision.
Verston’s journey with Rail Baltica
Rail Baltica, one of Europe’s largest infrastructure projects, crossing three countries, is our data laboratory. We have learned a great deal there, even if we will not claim to have solved this. There are a number of ways to collect data, but each asks the same question: what has actually been built, and does it match the plan? Here are some examples.
Machine control provides a real-time view of what is being built. Our machines are connected to a central system that stores both the design and all current project data. Every point a machine measures flows directly in, giving us an up-to-date view of the volumes moved – compared directly to the design. We see it as it happens, while there is still time to act. Not at the end of the month, when it is already too late.
Combining drone data with how things have always been done revealed a 25% gap that had not been measured. On one site, every truckload was weighed in tonnes while a drone measured the volume of material actually placed. The team had always assumed a density of 1.9 tonnes per cubic meter – nobody questioned it.
Putting the weighed tonnes next to the measured volume showed the real figure was closer to 2.4: a 25% difference from the number everyone had relied on. In practice, that significantly changes how we calculate progress and quantities. Nobody had made a mistake; they had simply never measured it.
“We thought we knew. Until we measured.”
An AI tool solved a problem before it existed. Each week, a drone flies the site and an AI-based tool compares completed work against the plan, returning an immediate overview of progress. On one site, everything looked on track – but the data flagged a collision a few weeks ahead: soon, there would be no space left to place crushed material. Excavation and blasting were each running at the right pace, yet both were heading toward the same bottleneck, run by different site managers in parallel. Nobody had seen it, because without data, you cannot see that far ahead. One decision changed the plan, and the problem was solved before it arose.
The same analysis did something else: for railway embankment layers, it showed exactly how many material samples were needed before the next layer went down, while there was still time to take them. In construction, the next layer comes fast, and once it is down, going back is complicated, expensive, sometimes impossible. For the first time, quality control was planned in advance rather than checked after the fact.
On the journey, not at the destination
A unified data collection process across all sites is our goal for 2026. We are not there yet. We have pilots that work, people who understand the value, and proof. What we are still building is the system that makes it non-negotiable – every site, every week. That is the discipline.
Most AI experiments in construction fail because the underlying data is chaotic and varies from project to project. The algorithms and the software are rarely the weak link.
“You cannot build intelligence on top of chaos.”
AI needs structure and consistency: the same data, collected the same way, every week. Every drone flight, every batch of machine control points entering the system, every surveyor measurement going straight into the database is an investment in the data culture that will one day make AI genuinely useful on-site. And the value reaches beyond construction. Collected with discipline, the same data flows across the whole project lifecycle – from procurement and design through construction and back into the next estimate – so the next project starts from what actually happened, not from assumptions.
Conclusion
We started with two numbers: 25% of projects on time, 8.5% on time and on budget. At the start of every project, we each place ourselves among the few who will succeed. But hope is not a strategy.
Standards are a dull topic. Yet standardized data makes interesting things possible – information that flows across a project’s full lifecycle, that feeds the next budget, that makes AI viable in practice. The clearest takeaway from InfraBIM Open in Paris was exactly this: the industry knows what the tools can do; what it is still working on is the habit of using them consistently, on every site, every week.
“We don’t have a technology problem. We have a data discipline problem.”
Sources:
- Bent Flyvbjerg & Dan Gardner, How Big Things Get Done (2023). Figures as cited by Flyvbjerg in New Civil Engineer, June 2023: https://www.newcivilengineer.com/latest/interview-programme-management-academic-bent-flyvbjerg-identifies-the-ingredients-of-successful-major-projects-26-06-2023/
- KPMG International, Global Construction Survey 2015 — “Climbing the curve”: https://assets.kpmg.com/content/dam/kpmg/pdf/2015/05/construction-survey-201502.pdf